


ETFGI, a leading independent research and consultancy firm covering trends in the global ETF/ETP ecosystem, reported today that ETFs and ETPs listed in Europe gathered net inflows of US$6.10 billion in March, bringing year-to-date net inflows to US$31.59 billion, more than the US$27.27 Bn gathered at this point last year. Assets invested in the European ETF/ETP industry finished the month up 1.09%, from US$850.28 billion at the end of February, to US$859.51 billion, according to ETFGI's March 2019 European ETF and ETP industry landscape insights report, an annual paid-for research subscription service. (All dollar values in USD unless otherwise noted.)
Highlights
- April 11th marks the 19th anniversary of the listing of the first ETF in Europe
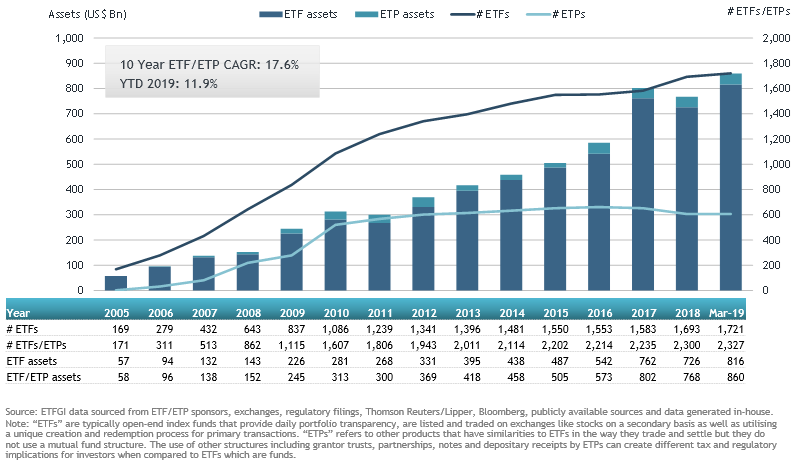
- Assets invested in the European ETF/ETP industry reach $859.51 Bn in March 2019, the highest on record.
- Assets invested in the European ETF/ETP industry have risen 11.95% year-to-date.
- 54th consecutive month of net inflows into ETFs/ETPs listed in Europe.
“Markets appear to have returned to the relative calm they had grown accustomed to over the past few years. Returns for developed indices decelerated in March, as the effects of more cautious and accommodative central bank policies lose steam. The S&P 500 finished March up 1.94%, with year-to-date returns of 13.65%, marking its best quarter since ‘09. The S&P Europe 350 rose 0.92% in March, as economic data from the region continues to send mixed signals, bringing year-to-date returns to 10.90%. The Topix 150 in Japan was up 0.32% in March, bringing year-to-date returns of 7.96%. Emerging & Frontier returns continued to outpace developed markets. The S&P Emerging BMI and Frontier BMI finished March up 1.74% and 1.37%, bringing year to date returns to 10.45% and 8.82%, respectively.” according to Deborah Fuhr, managing partner and founder of ETFGI.
April 11th marks the 19th anniversary of the listing of the first ETFs in Europe. European Exchange Traded Fund Company launched two listed diversified return securities (LDRS) on the Deutsche Borse. These funds are co-managed by Merrill Lynch and track the Dow Jones Euro Stoxx 50 and Stoxx 50 indexes.
At the end of March 2019, the European ETF/ETP industry had 2,327 ETFs/ETPs, from 69 providers listed on 29 exchanges. Following net inflows of $6.10 Bn and market moves during the month, assets invested in the European ETF/ETP industry increased by 1.09% from $850.28 Bn at the end of February, to $859.51 Bn.
Growth in European ETF and ETP assets as of the end of March 2019
Equity ETFs/ETPs listed in Europe saw net outflows of $846.49 Mn in March, bringing net inflows for 2019 to $10.18 Bn, substantially less than the $22.49 Bn in net inflows equity products had attracted by the end of March 2018. Fixed income ETFs/ETPs listed in Europe attracted net inflows of $6.58 Bn in March, bringing net inflows for 2019 to $19.91 Bn, considerably greater than the $3.46 Bn in net inflows fixed income products had attracted by the end of March 2018.
Substantial inflows can be attributed to the top 20 ETFs by net new assets, which collectively gathered $7.97 Bn in March, the iShares Core € Corp Bond UCITS ETF (IEBC LN) gathered $1.26 Bn alone.
Top 20 ETFs by net new assets March 2019: Europe
|
Name |
Ticker |
Assets |
NNA |
NNA |
|
iShares Core € Corp Bond UCITS ETF |
IEBC LN |
10,538 |
2,026 |
1,263 |
|
iShares Core MSCI World UCITS ETF |
IWDA LN |
16,553 |
921 |
865 |
|
iShares J.P. Morgan EM Local Govt Bond UCITS ETF |
SEML LN |
9,017 |
2,284 |
787 |
|
iShares Edge MSCI USA Quality Factor UCITS ETF |
IUQA LN |
602 |
480 |
459 |
|
iShares € High Yield Corp Bond UCITS ETF |
IHYG LN |
6,678 |
1,074 |
429 |
|
iShares Core MSCI EM IMI UCITS ETF |
EMIM LN |
12,755 |
1,273 |
367 |
|
iShares J.P. Morgan $ EM Bond UCITS ETF |
SEMB LN |
7,911 |
1,213 |
364 |
|
iShares € Corp Bond 1-5yr UCITS ETF |
IE15 LN |
4,676 |
784 |
354 |
|
iShares $ High Yield Corp Bond UCITS ETF |
IHYU LN |
3,488 |
760 |
330 |
|
SPDR MSCI World UCITS ETF |
SPPW GY |
318 |
316 |
316 |
|
iShares Global High Yield Corp Bond UCITS ETF |
HYLD LN |
907 |
378 |
300 |
|
iShares $ Treasury Bond 1-3yr UCITS ETF |
IBTA LN |
1,457 |
428 |
293 |
|
SPDR MSCI Europe Consumer Staples ETF |
STS FP |
403 |
206 |
269 |
|
SPDR Barclays 0-3 Year Euro Corporate Bond UCITS ETF |
SYBD GY |
2,277 |
407 |
247 |
|
iShares US Mortgage Backed Securities UCITS ETF |
SMBS LN |
650 |
312 |
244 |
|
Vanguard FTSE 250 UCITS ETF |
VMID LN |
1,547 |
536 |
238 |
|
iShares Core S&P 500 UCITS ETF |
CSSPX SW |
31,588 |
(894) |
217 |
|
iShares Core S&P 500 UCITS ETF (GBP) |
GSPX NA |
1,079 |
309 |
217 |
|
PIMCO Euro Short Maturity ETF |
PJS1 GY |
2,032 |
(444) |
213 |
|
iShares € Corp Bond Large Cap UCITS ETF |
IBCS GY |
4,221 |
445 |
194 |

The top 10 ETPs by net new assets collectively gathered $327.43 Mn in March, the Xtrackers Physical Gold GBP Hedged ETC (XGLS LN) gathered $63.57 Mn alone.
Top 10 ETPs by net new assets March 2019: Europe
|
Name |
Ticker |
Assets |
NNA |
NNA |
|
Xtrackers Physical Gold GBP Hedged ETC |
XGLS LN |
131 |
69 |
64 |
|
ETFS WTI Crude Oil |
CRUD LN |
683 |
50 |
62 |
|
Xetra Gold EUR |
4GLD GY |
8,015 |
453 |
37 |
|
Xtrackers Physical Gold Euro Hedged ETC |
XAD1 GY |
1,790 |
(60) |
34 |
|
ETFS GBP Daily Hedged Physical Gold (GBSP) |
GBSP LN |
294 |
113 |
30 |
|
ETFS Short USD Long EUR |
XBJQ GY |
73 |
29 |
24 |
|
ETFS Long JPY Short USD |
LJPY LN |
23 |
23 |
22 |
|
ETFS Nickel |
NICK LN |
525 |
16 |
22 |
|
iShares Physical Gold ETC |
SGLN LN |
4,428 |
36 |
20 |
|
ETFS Coffee |
COFF LN |
98 |
30 |
14 |
Investors have tended to invest in large cap equity/fixed income ETFs in March.

