


ETFGI, a leading independent research and consultancy firm covering trends in the global ETF/ETP ecosystem, reported today that ETFs and ETPs listed Globally gathered net inflows of US$44.31 billion in February, bringing year-to-date net inflows to US$61.66 billion. Assets invested in the Global ETF/ETP industry finished the month up 3.15%, from US$5.16 trillion at the end of January, to reach a record US$5.32 trillion, according to ETFGI's February 2019 Global ETF and ETP industry landscape insights report, an annual paid-for research subscription service. (All dollar values in USD unless otherwise noted.)
Highlights
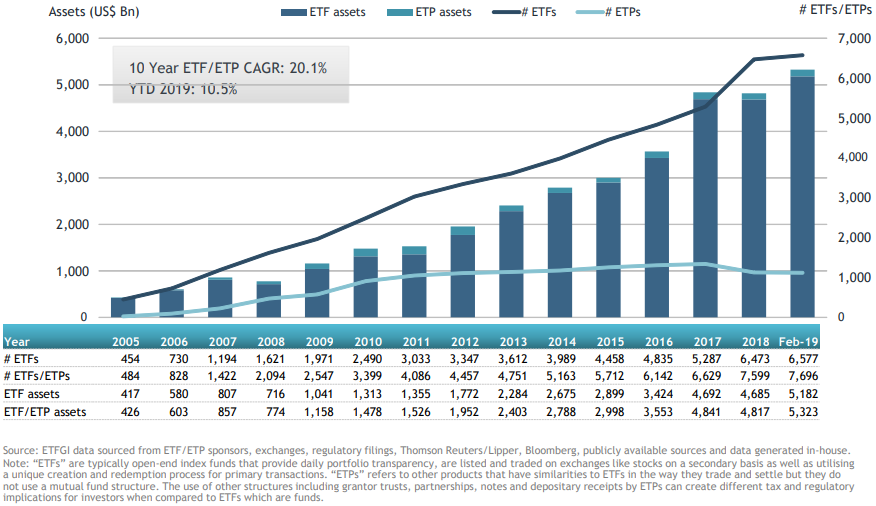
- Assets invested in the Global ETF/ETP industry reached $5.32 Tn in February 2019, the highest on record.
- Happy 39th anniversary to the ETF industry - first ETF the TIPs - Toronto 35 Index Participation units was listed in Canada on March 9, 1990.
- 61 consecutive months of net inflows into ETFs/ETPs listed globally.
“Throughout February markets pushed higher, resulting in the best start to the year since 1996, with major US indices comfortably erasing any hangover felt from the Q4 ’18 market rout. US-China trade talks appeared to have made good progress while Brexit stalled even with the 29th march deadline looming. Central banks in the developed economies have maintained an accommodative stance to ease growth slowdown fears, with the US Federal Reserve reiterating their new ‘patient’ policy stance. The S&P 500 was up 3.21% by the end of February bringing year-to-date returns to 11.48%, similarly the S&P Europe 350 was up 3.45% for the month, with year-to-date returns of 9.89%. The Topix 150 finished February up 0.33%, with year-to-date returns of 7.62%. Emerging and frontier markets saw more modest gains, finishing February up 0.74% and 2.62%, bringing year-to-date returns to 8.56% and 7.35%, respectively.” according to Deborah Fuhr, managing partner and founder of ETFGI.
At the end of February 2019, the Global ETF/ETP industry had 7,696 ETFs/ETPs, from 411 providers listed on 72 exchanges in 58 countries. Following net inflows of $44.31 Bn and market moves during the month, assets invested in the Global ETF/ETP industry increased by 3.15% from $5.16 Tn at the end of January, to $5.32 Tn.
Growth in Global ETF and ETP assets as of the end of February 2019

Equity ETFs/ETPs listed Globally attracted net inflows of $28.62 Bn in February, bringing net inflows for 2019 to $19.79 Bn, substantially less than the $90.95 Bn Mn in net inflows equity products had attracted by the end of February 2018. Fixed income ETFs/ETPs listed Globally attracted net inflows of $14.71 Bn in February, bringing net inflows for 2019 to $38.38 Bn, greater than the $13.72 Bn in net inflows fixed income products had attracted by the end of February 2018.
Substantial inflows can be attributed to the top 20 ETF's by net new assets, which collectively gathered $27.20 Bn in February, the SPDR S&P 500 ETF Trust (SPY US) gathered $3.09 Bn alone.
Top 20 ETFs by net new assets February 2019: Global
|
Name |
Ticker |
Assets |
NNA |
NNA |
|
SPDR S&P 500 ETF Trust |
SPY US |
262,427 |
(5,156) |
3,094 |
|
Vanguard Total International Bond ETF |
BNDX US |
15,855 |
2,561 |
2,151 |
|
iShares MBS ETF |
MBB US |
15,592 |
3,219 |
1,722 |
|
Vanguard Real Estate ETF |
VNQ US |
32,604 |
1,467 |
1,664 |
|
iShares 7-10 Year Treasury Bond ETF |
IEF US |
13,218 |
3,053 |
1,620 |
|
Vanguard FTSE Emerging Markets ETF |
VWO US |
62,465 |
2,282 |
1,620 |
|
iShares MSCI USA Minimum Volatility ETF |
USMV US |
23,506 |
2,551 |
1,510 |
|
BHARAT 22 ETF |
ICICIB22 IN |
2,224 |
1,490 |
1,493 |
|
UBS ETFs plc - MSCI ACWI SF UCITS ETF (hedged to USD) A-acc |
ACWIU SW |
2,237 |
1,354 |
1,355 |
|
UBS ETFs plc - MSCI ACWI SF UCITS ETF (hedged to CHF) A-acc |
ACWIS SW |
1,919 |
1,210 |
1,241 |
|
iShares Core S&P Total U.S. Stock Market ETF |
ITOT US |
18,472 |
1,383 |
1,204 |
|
UBS ETFs plc - MSCI ACWI SF UCITS ETF (hedged to EUR) A-acc |
ACWIE SW |
2,094 |
1,162 |
1,133 |
|
TOPIX Exchange Traded Fund |
1306 JP |
78,772 |
3,303 |
1,091 |
|
NEXT FUNDS Nikkei 225 Double Inverse Index Exchange Traded Fund |
1357 JP |
1,972 |
1,396 |
1,074 |
|
iShares 20+ Year Treasury Bond ETF |
TLT US |
10,951 |
2,274 |
980 |
|
iShares U.S. Real Estate ETF |
IYR US |
4,542 |
706 |
925 |
|
iShares iBoxx $ Investment Grade Corporate Bond ETF |
LQD US |
32,522 |
1,966 |
881 |
|
iShares iBoxx $ High Yield Corporate Bond ETF |
HYG US |
15,342 |
1,342 |
834 |
|
iShares J.P. Morgan EM Local Govt Bond UCITS ETF |
SEML LN |
8,340 |
1,498 |
805 |
|
iShares Core U.S. Aggregate Bond ETF |
AGG US |
58,021 |
517 |
803 |

Substantial inflows can be attributed to the top 10 ETP's by net new assets, which collectively gathered $1.78 Bn in February, the VelocityShares Daily 2x VIX Short Term ETN (TVIX US) gathered $364.93 Mn alone.
Top 10 ETPs by net new assets February 2019: Global
|
Name |
Ticker |
Assets |
NNA |
NNA |
|
VelocityShares Daily 2x VIX Short Term ETN |
TVIX US |
612 |
474 |
365 |
|
iPath Series B S&P 500 VIX Short-Term Futures ETN |
VXXB US |
669 |
595 |
316 |
|
iShares Gold Trust |
IAU US |
12,701 |
810 |
299 |
|
ProShares Ultra VIX Short-Term Futures |
UVXY US |
472 |
464 |
220 |
|
SPDR Gold MiniShares Trust |
GLDM US |
639 |
228 |
122 |
|
Large Cap Growth Index-Linked Exchange Traded Notes due 2028 |
FRLG US |
619 |
133 |
102 |
|
VelocityShares Daily 3x Long Natural Gas ETN |
UGAZ US |
584 |
359 |
95 |
|
Invesco Gold ETC |
SGLD LN |
5,269 |
182 |
92 |
|
ETFS Industrial Metals DJ-UBSCISM |
AIGI LN |
344 |
137 |
90 |
|
Xetra Gold EUR |
4GLD GY |
8,090 |
416 |
79 |
Investors have tended to invest in large cap equity/fixed income ETFs in February.

